China’s national economy is ranked second in the world, the first being the United States. On the other hand, China is the world’s number one exporter of goods and has held that title since 2009.
They export so many products that China is nicknamed the “World’s Factory,” and with their entry into the World Trade Organization (WTO) in 2001, more and more Chinese-made products are steadily getting imported into the United States.
It’s inevitable that when you go to nearly any store or shop online, you’ll most often come across products labeled “Made in China.” It’s long been known that China and some other countries have extremely low labor costs, which dramatically lowers the cost of production.
That, in turn, means more manufacturers produce their goods overseas, then import them into the United States and other countries for larger profits. Which leads to the question, what percent of products are made in China?
According to the World Bank, China accounted for about 28.5 percent of global manufacturing output in 2020. This is significantly more than the United States, which accounted for about 17.34 percent.
Global Chinese Production
China truly is the “World’s Factory” because they lead the pack by manufacturing 28.5% of the world’s products. That may not seem like a huge number, but let’s take a look at it another way. There are 164 countries in the WTO. That means out of all those countries combined; China still makes nearly 30% of the world’s products. If that number still doesn’t seem that large, look at the dollar amount; China’s exports equaled $3.36 trillion in 2021. That’s a 3 with 12 zeros behind it!
The five products China manufactures the most then exports are broadcasting equipment, computers, office machine parts, integrated circuits for computers and electronics, followed by phones.
China is the world’s largest manufacturer of electronics. Chinese factories are often set up so that parts and components factories are nearby where the final assembly factories are located to cut down on logistics time.
Next, let’s take a look at manufacturing by country and see how the other top manufacturing countries compare to China.
Table Showing China Manufacturing Compared to Other Top Countries
| Rank | Country or Region | Global Manufacturing Output (%) |
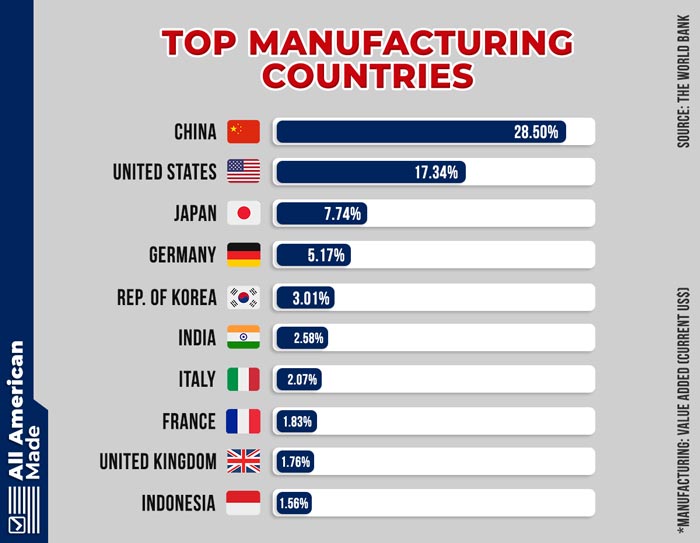
| 1 | China | 28.50% |
| 2 | United States | 17.34% |
| 3 | Japan | 7.74% |
| 4 | Germany | 5.17% |
| 5 | Rep, of Korea | 3.01% |
| 6 | India | 2.58% |
| 7 | Italy | 2.07% |
| 8 | France | 1.83% |
| 9 | United Kingdom | 1.76% |
| 10 | Indonesia | 1.56% |
| 11 | Russia | 1.46% |
| 12 | Mexico | 1.37% |
| 13 | Canada | 1.26% |
| 14 | Ireland | 1.09% |
| 15 | Spain | 1.05% |
| 16 | Brazil | 1.04% |
| 17 | Turkey | 1.02% |
| 18 | Switzerland | 1.02% |
| 19 | Thailand | 0.94% |
| 20 | Netherlands | 0.72% |
| 21 | Poland | 0.71% |
| 22 | Saudi Arabia | 0.70% |
| 23 | Malaysia | 0.56% |
| 24 | Australia | 0.56% |
| 25 | Austria | 0.52% |
| 26 | Singapore | 0.52% |
| 27 | Sweden | 0.49% |
| 28 | Belgium | 0.48% |
| 29 | Phillippines | 0.47% |
| 30 | Argentina | 0.44% |
| 31 | Egypt | 0.44% |
| 32 | Bangladesh | 0.44% |
| 33 | Venezuela | 0.43% |
| 34 | Nigeria | 0.41% |
| 35 | Czech Republic | 0.40% |
| 36 | Puerto Rico | 0.37% |
| 37 | Denmark | 0.37% |
| 38 | Israel | 0.34% |
| 39 | Vietnam | 0.34% |
| 40 | South Africa | 0.29% |
| 41 | Romania | 0.29% |
| 42 | Finland | 0.29% |
| 43 | Iran | 0.27% |
| 44 | United Arab Emirates | 0.26% |
| 45 | Pakistan | 0.22% |
| 46 | Columbia | 0.22% |
| 47 | Algeria | 0.20% |
| 48 | Hungary | 0.20% |
| 49 | Portugal | 0.20% |
| 50 | Chile | 0.18% |
Source: Wordbank.org
What Percent of Products in America Are Made in China?

Before China entered the WTO in 2001, you probably wouldn’t have seen too many products that bore the label, Made in China. But since then, Chinese imports to the US have risen 325%. Most of the products we see coming into the United States from China include electronics, machinery, toys, exercise and sports equipment, furniture, bedding, and textiles.
The United States imports about 18% to 20% of all goods from China, but the more sobering number is that about 60% of what you buy in the store is either Made in China or has some percentage of Chinese content in the product, or includes Chinese labor.
The following list includes items that are almost completely made in China, followed by the percentage of how much of these products come from the land of the red dragon.
- Electric Blankets: 99%. If you own or are looking for an electric blanket, you’d be hard-pressed to find one not made in China.
- Telescopic umbrellas: 98%. China seems to own the market for telescoping handle umbrellas.
- Video game consoles: 98%. When you think of video game consoles, you immediately think of Xbox, Sony Playstation, or the Nintendo Switch. All of which are manufactured in China.
- Plastic and non-plastic artificial flowers: 97%. America seems to be obsessed with artificial flowers, and China is the place to make both plastic, paper, and fabric artificial flowers.
- Cooking appliances and plate warmers: 97%. Mostly smaller appliances that have metal housings or heating elements.
- Electric toasters: 97%. Virtually all toasters are made in China. Even brands like Oster, Black and Decker, and Hamilton Beach are all made in China.
- Thermoses: 97%. Most vacuum-sealed thermoses are made in China. Even the company Thermos itself has operations in China. You can still find some that are made in America, but it’s difficult.
- Garden umbrellas: 97%. Patio umbrellas, or the ones that sit in the middle of your outdoor table, yep, probably made in China
- Portable tape recorders and radio players: 96%. With more music options in cell phones, digital music, music apps, and Bluetooth speakers, these products are quickly dying off, but there are a few manufacturers still, but they’re in China.
- Baby carriages: 95%. Expecting parents can expect to find Chinese-manufactured baby strollers wherever they look.
Other Top Countries America Receives Imports From

Only five countries make up over 50% of all our imported products. China is the largest importer of them all with nearly 20% of all imports coming to America. The remaining four big importers and the percentage of products that come to the United States are:
- Mexico: 14.07% of products imported into the United States come from Mexico. Their major imports include vehicles and parts
- Canada: We get 12.72% of goods from Canada. These products include oil, natural gas, and uranium.
- Japan: Surprisingly, Japan comes in the single digits with 5.72% of goods. Their main imports to the US are automobiles such as Toyota and Honda. They also supply us with a lot of machinery, medical instruments, and aircraft parts.
- Germany: 5.06% of imports come from Germany. They provide industrial machinery, precision instruments, pharmaceuticals, and plastics. They also send over high-end automobiles such as BMW, Mercedes-Benz, and Porsche.
The reason we get so many products from the countries is that they have one or more advantages in manufacturing over the United States. China, Canada, and Mexico supply some of the lowest-cost goods because of slippery tax laws or simply dirt-cheap labor.
Germany is able to provide exceptionally high-quality items because quality is part of their way of life. Beginning with German education, which follows an apprenticeship-based system that produces great engineers and machinists, down to having a highly paid and trained workforce that focuses on a perfectionist mindset. German products are strictly regulated and extensively tested to make sure their products are among the absolute best.
Japan tends to focus on specific products that work for target markets. They create a lot of products that add value to existing products or make them work better. Japan focuses on electronics, vehicles, integrated circuits, diodes, and transistors that are needed for machinery and electrical products.
What Are The Top Manufacturing Countries
1. China
The top ten countries make up about 72% of the world’s manufacturing output. China tops that list by making 28.5% of the world’s output. They are also the world leader in the manufacture of electronics. Many agricultural products come from China as well. In fact, they are the leading producer of cereal, cotton, vegetables, fruit, eggs, and meats, including poultry and fishery products.
2. The United States
Coming in at number two for global manufacturing output at 17.34% is the United States believe it or not. The biggest exports that come from the United States include commercial aircraft, mostly from Boeing. Then we have Industrial machines, semiconductors, electric apparatus, such as fittings, insulators, and anything having to do with electricity. Rounding out the top six exports from the US are telecommunications and medical equipment—the majority of which come from small businesses.
3. Japan
The third largest global manufacturer is Japan at 7.74%. Being such a small country, Japan is not able to export as much product as larger countries like China, but they still manage to produce a lot of electronic equipment and cars for the rest of the world.
4. Germany
Next comes Germany at 5.17% of global manufacturing. Their main exports include cars, such as the brands that they send to the United States. BMW, Mercedes, and Porsche are the most popular vehicles. Machinery and chemical products are the second and third biggest exports from Germany.
5. Korea
Rounding out the top five comes Korea, which produces 3.01% of global manufacturing output. Their notable exports include cars, office machines, and vehicle parts. Other notable exports include machinery, electrical machinery, plastics, and mineral fuels. Korea also exports a lot of cereals, baked goods, fruits and vegetables, and tobacco to the US.
The next five countries only make up a combined 10% of all global manufacturing output. These countries in order are; India–2.58%, Italy–2.07%, France–1.83%, United Kingdom–1.76%, and Indonesia–1.56%.
If we group this up by continent, we see much more sobering numbers. The continent with the largest landmass also makes up the lion’s share of manufacturing by creating 52% of the world’s products. Europe comes in second, creating less than half of what Asia makes. All of Europe combined only makes 22% of the world’s products. North America is third in the world at a respectable 18%. Next, and much lower in percentage is South America at 5%, followed by Africa with 2% and Oceania with 1% of the world’s products.
Food Imports From China
In 2020 the US imported $3.8 billion in agricultural products from China, which is the 7th largest supplier of these products. The top imported products were mostly processed fruits and vegetables. This includes fruit and vegetable juices, dried fruits, pickled produce, and canned products. The United States imported $1.1 billion in processed produce. The second largest agricultural product imported from China was dog and cat food, coming in at $202 million, and other livestock products. These include meat, poultry, eggs, and fish, equaling $193 million in imports.
How Does China Export So Many Items?
Most of us know that China has some of the lowest labor rates in the world and that’s why so many companies send their products to China to be manufactured. Inexpensive labor is one reason it’s lucrative to send products to China. Let’s discuss why everything seems to be made in China below.
China has a huge potential workforce. For each person that leaves the Chinese workforce, there are many, many more willing to take their place. Most are not opposed to taking lower wages just for the opportunity to work. On the other hand, in the last couple of years, America has seen a huge surge in workers voluntarily leaving the workforce. It’s been reported that 4.53 million workers have resigned from their jobs since the pandemic. The reason so many have left their jobs, it seems, is because they were fed up and no longer willing to put up with the working conditions and/or pay.
America also has a lot more safety and environmental regulations to look out for the health of employees and the impact of pollution from factories. The Chinese government is very lax when it comes to employee safety. If someone gets hurt on the job and can’t work, they are quickly replaced while the injured employee has no recourse. There is very little environmental oversight when it comes to Chinese manufacturing plants and pollution. All these regulations cost money for American companies, but when they send these jobs and products over to China to be manufactured, they save more money.
China has many more factories operating at full capacity compared to America. They work longer, again for less money, and have so many more manufacturing capabilities than America does. Their factories are often very close to each other, making it easier to get parts and put together final products faster.
Here is an inside look at a factory in China:
Let’s say America imported parts from China to make televisions here on domestic soil because we didn’t have the raw materials to make everything here. While putting the television together, it was found that there was a part that didn’t work right; let’s say a wire was too short. The factory would then have to send the defective wires back to China and then wait for them to send the correct length wires back.
Meanwhile, the factory isn’t running because they can’t finish the TVs without that wire. Orders are getting backed up, people start searching for new jobs because they can’t go weeks without a paycheck, and everything comes to a halt because of one seemingly minuscule part. While in China, all the factories that make the parts and components for that television are nearby. If they get a part that isn’t the right size, they might have to wait hours to a day or two before they can get back to work, not weeks or months.
China also has a lot of natural resources at its disposal. They have aluminum, copper, petroleum, and iron ore, and they import a lot of processed metals and plastics. That way, they are able to create more parts and components—usually for electronics—then go ahead and complete the manufacturing process. All of these elements combined make it so much easier for China to create so many products to send all over the world. And so, China is able to be the World’s Factory that exports more products than any other country in the world.
How Can You Find More American Goods?
Look at the labels. Unfortunately, not everything in America is required to have a label of origin, but most companies will proudly display that their product is made in America if it is. Look out for misleading labels. We have a full article on what Made in the USA actually means here if you’re interested. Some manufacturers will try to trick the consumer by using pictures of the flag or stating obscure language like “Designed in America.” These are usually followed by “Manufactured in (country).”
Do internet searches to find out if certain products are made in America. If the company website doesn’t explicitly say their products are made in the United States, they probably aren’t.
Also, you can sign up for our emails as we constantly put out new articles about American Made products.
Table Showing Global Manufacturing Output
| Rank | Country or Region | Millions of Dollars in US |
| World | 13,498,481.18 | |
| 1 | China | 3,853,808.25 |
| 2 | United States | 2,341,847.48 |
| 3 | Japan | 1,045,547.65 |
| 4 | Germany | 698,896.09 |
| 5 | Rep, of Korea | 406,373.29 |
| 6 | India | 348,365.14 |
| 7 | Italy | 280,398.64 |
| 8 | France | 247,025.04 |
| 9 | United Kingdom | 238,693.72 |
| 10 | Indonesia | 210,396.30 |
| 11 | Russia | 196,649.19 |
| 12 | Mexico | 185,558.06 |
| 13 | Canada | 170,222.21 |
| 14 | Ireland | 147,001.70 |
| 15 | Spain | 141,307.93 |
| 16 | Brazil | 141,148.85 |
| 17 | Turkey | 137,709.06 |
| 18 | Switzerland | 136,456.54 |
| 19 | Thailand | 126,596.41 |
| 20 | Netherlands | 98,385.35 |
| 21 | Poland | 95,607.61 |
| 22 | Saudi Arabia | 90,774.16 |
| 23 | Malaysia | 75,082.19 |
| 24 | Australia | 75,037.54 |
| 25 | Austria | 70,465.77 |
| 26 | Singapore | 69,820.40 |
| 27 | Sweden | 65,614.19 |
| 28 | Belgium | 64,603.64 |
| 29 | Phillippines | 63,882.60 |
| 30 | Argentina | 59,830.49 |
| 31 | Egypt | 59,819.59 |
| 32 | Bangladesh | 59,803.70 |
| 33 | Venezuela | 58,236.96 |
| 34 | Nigeria | 54,759.80 |
| 35 | Czech Republic | 53,747.42 |
| 36 | Puerto Rico | 49,756.90 |
| 37 | Denmark | 49,697.07 |
| 38 | Israel | 46,099.14 |
| 39 | Vietnam | 45,272.98 |
| 40 | South Africa | 39,392.66 |
| 41 | Romania | 39,239.16 |
| 42 | Finland | 38,995.72 |
| 43 | Iran | 35,996.93 |
| 44 | United Arab Emirates | 34,752.04 |
| 45 | Pakistan | 30,110.17 |
| 46 | Columbia | 29,899.46 |
| 47 | Algeria | 27,297.86 |
| 48 | Hungary | 27,251.17 |
| 49 | Portugal | 27,109.53 |
| 50 | Chile | 25,115.35 |
Wrap Up
That does it for this article. If you have any questions regarding the top manufacturing countries, feel free to ask us in the comments below.
Hi, my name is Kevin and I’m from Pittsburgh, Pennsylvania. Choosing products made in America is important to me because it supports local economies, creates jobs, helps the environment, and ensures ethical labor practices. I also find that American made products are usually of higher quality so although they’re a little more expensive, you save money in the long run. Before starting this website I was in the USMC infantry and nowadays I work on this website as a hobby.
It really is insane that we are allowing China to take over the whole world in terms of manufacturing. Looking at the number of computer parts, lithium-ion batteries, and semiconductors they make it’s truly frightening.
Hey Rich, I agree that China is becoming a problem. We are far too reliant on certain categories of products like you mentioned. Thanks for your comment.